Examples
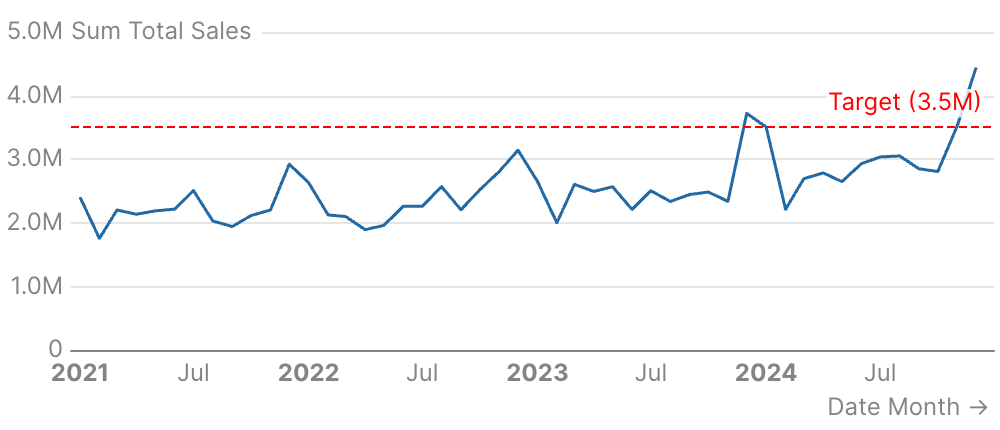
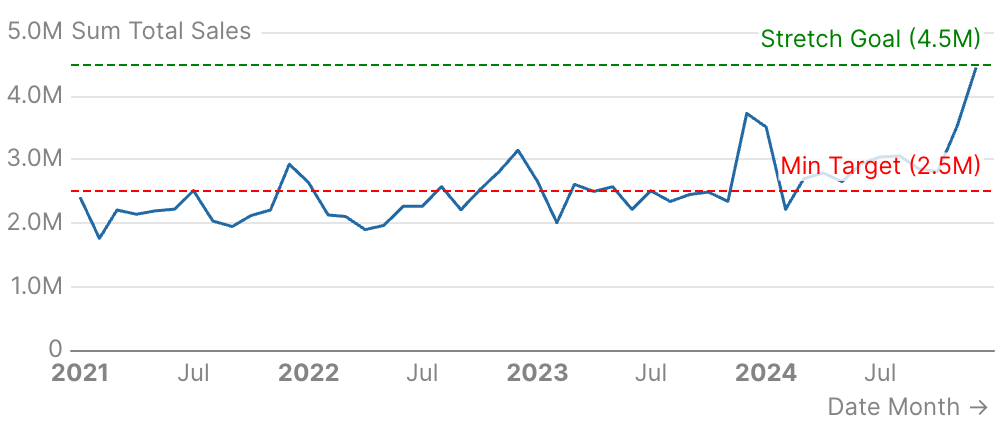
Horizontal Target Line
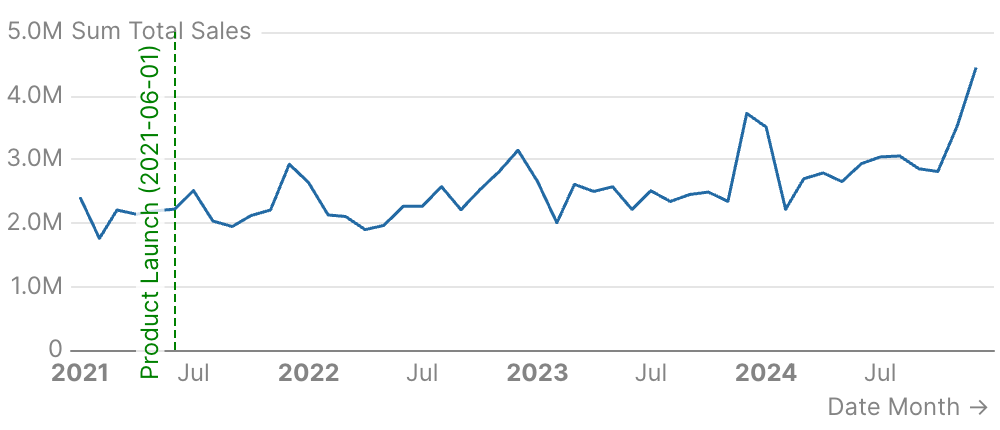
Vertical Line at Date
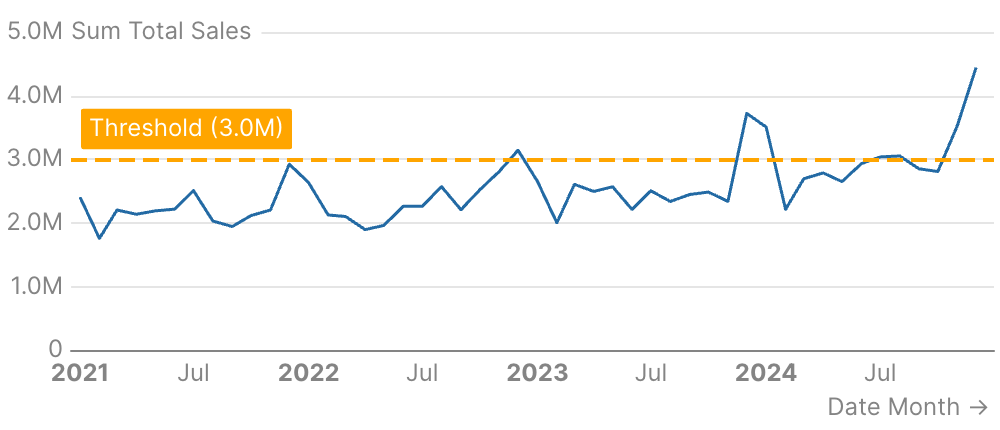
Reference Lines from Data
Custom Label Styling
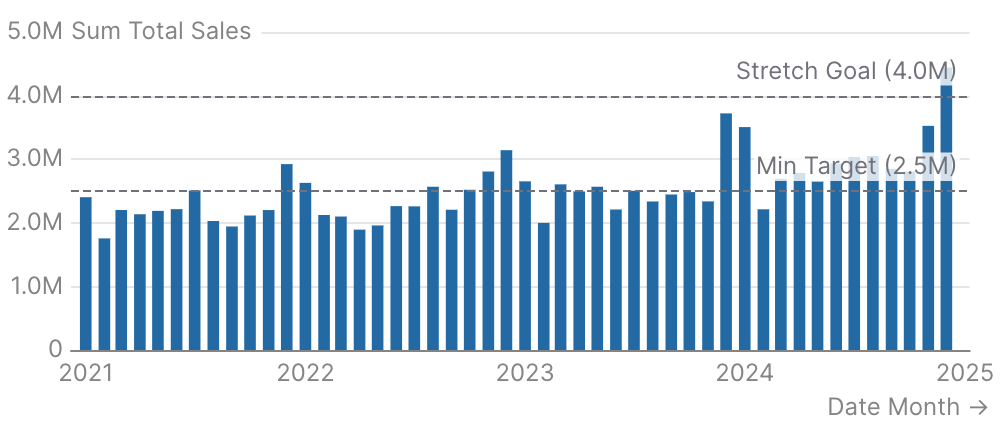
Multiple Reference Lines
Attributes
Query name to use for calculating dynamic reference values
Text label to display on the reference line
X-axis value for a vertical reference line (e.g., a date or category)
Y-axis value for a horizontal reference line (e.g., a target or threshold)
Starting x-coordinate for a sloped line
Starting y-coordinate for a sloped line
Ending x-coordinate for a sloped line
Ending y-coordinate for a sloped line
Color of the reference line
Styling options for the labelExample:Attributes:
- position:
string- Allowed values:
above_endabove_startabove_centerbelow_endbelow_startbelow_center
- Allowed values:
- align:
string- Allowed values:
leftcenterright
- Allowed values:
- color:
string - background_color:
string - padding:
number - fmt:
string- Format the label value. Defaults to series or axis fmt.- Allowed values: See Value Formatting for all available formats.
- hide_value:
boolean - border:
options group- Options:
- width:
number - type:
string- Allowed values:
soliddasheddotted
- Allowed values:
- color:
string - radius:
number
- width:
- Options:
- text:
options group- Options:
- size:
number - bold:
boolean - italic:
boolean
- size:
- Options:
Styling options for the line itselfExample:Attributes:
- color:
string - width:
number- Width of the line - type:
string- Allowed values:
soliddasheddotted
- Allowed values:
- opacity:
number- Between 0 and 1
Symbol shapes to display at line endpointsExample:Attributes:
- start:
options group- Options:
- shape:
string- Allowed values:
circleemptyCirclerectroundRecttrianglediamondpinarrownoneimage://path://
- Allowed values:
- size:
number
- shape:
- Options:
- end:
options group- Options:
- shape:
string- Allowed values:
circleemptyCirclerectroundRecttrianglediamondpinarrownoneimage://path://
- Allowed values:
- size:
number
- shape:
- Options: