Examples
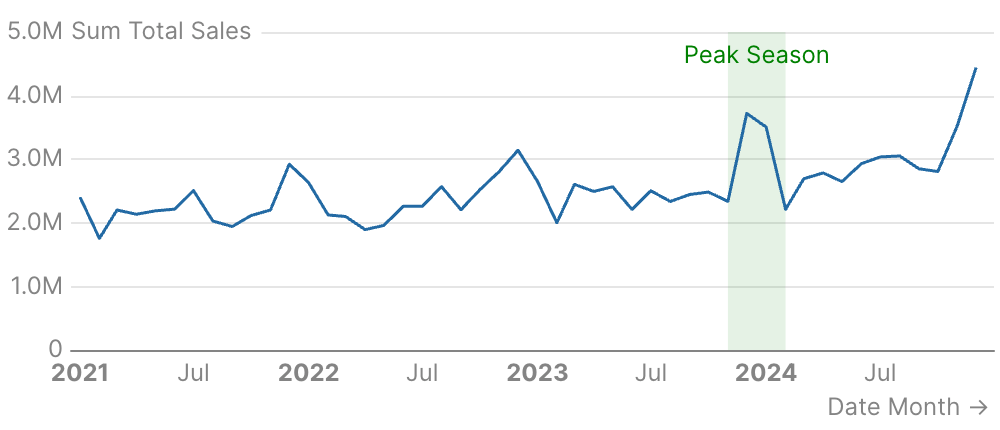
Highlight Date Range
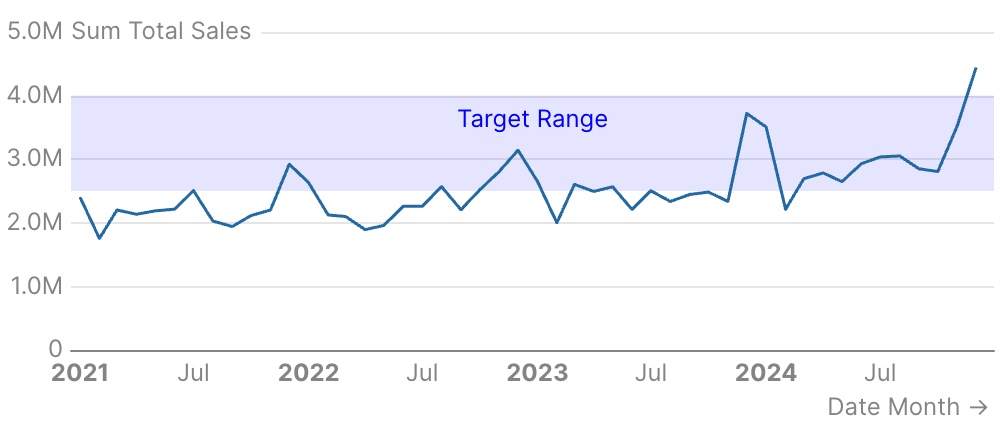
Horizontal Value Band
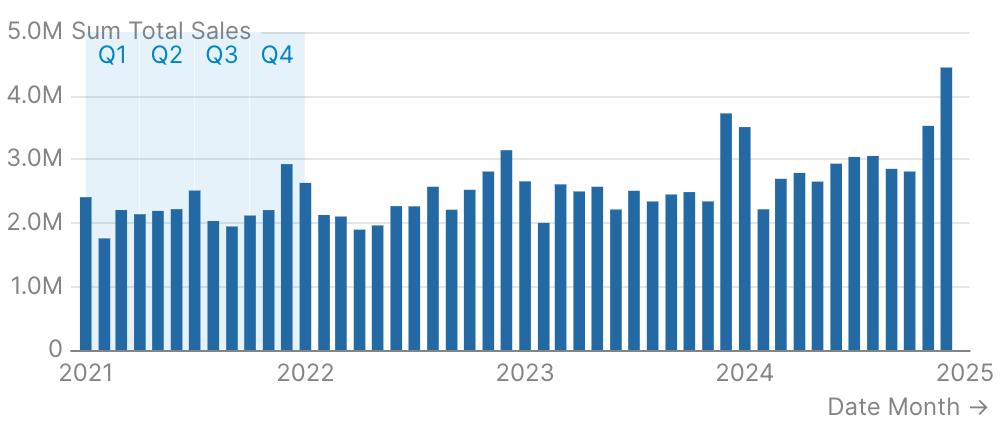
Areas from Data
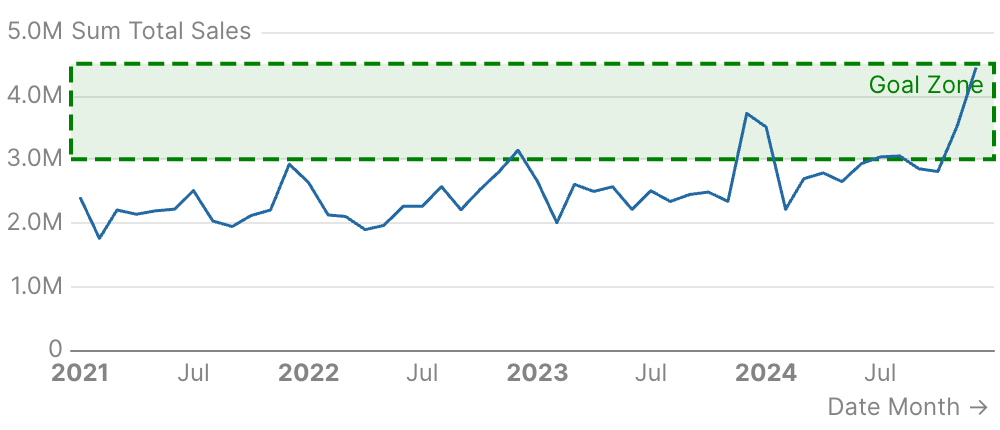
Custom Styling
Attributes
Query name to use for calculating dynamic area boundaries
Text label to display in the reference area
Left boundary of the area (e.g., a start date)
Right boundary of the area (e.g., an end date)
Bottom boundary of the area (e.g., a minimum value)
Top boundary of the area (e.g., a maximum value)
Fill color of the reference area
Styling options for the labelExample:Attributes:
- position:
string- Allowed values:
top_lefttoptop_rightbottom_leftbottombottom_rightleftcenterright
- Allowed values:
- align:
string- Allowed values:
leftcenterright
- Allowed values:
- color:
string - background_color:
string - padding:
number - border:
options group- Options:
- width:
number - type:
string- Allowed values:
soliddasheddotted
- Allowed values:
- color:
string - radius:
number
- width:
- Options:
- text:
options group- Options:
- size:
number - bold:
boolean - italic:
boolean
- size:
- Options:
Styling options for the area fill and borderExample:Attributes:
- color:
string - opacity:
number - border:
options group- Options:
- width:
number - type:
string- Allowed values:
soliddasheddotted
- Allowed values:
- color:
string
- width:
- Options: