Examples
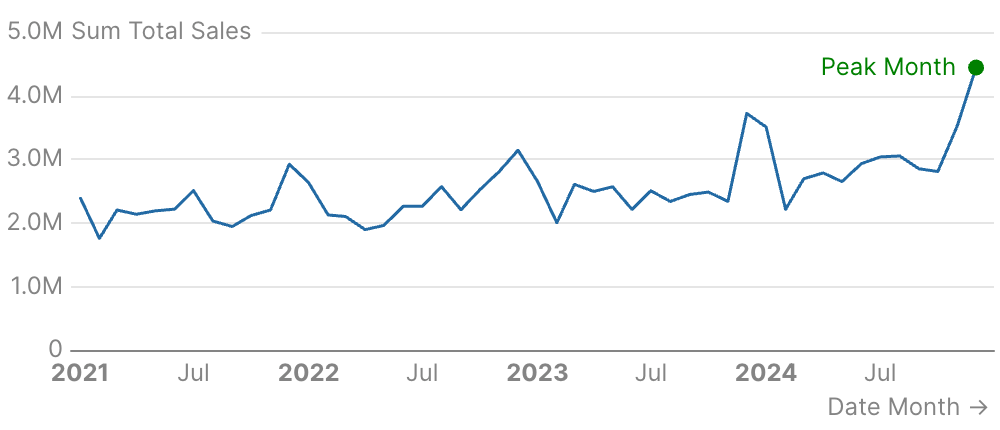
Hardcoded Point
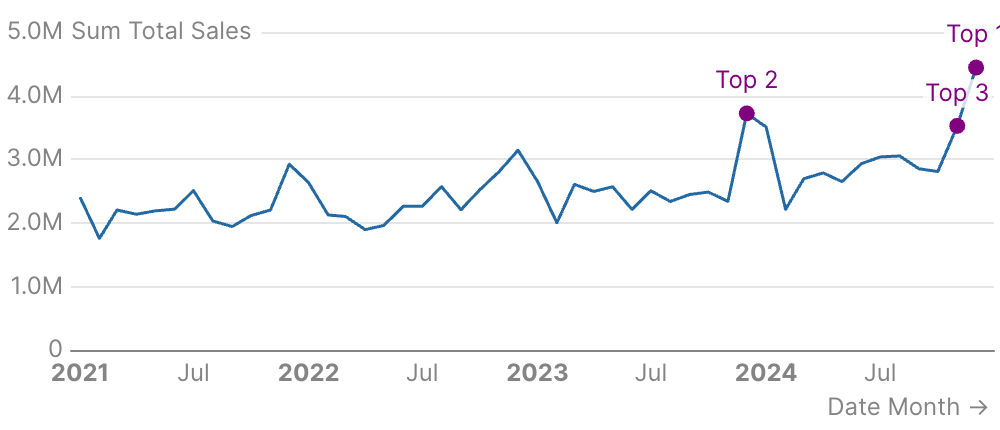
Point from Data
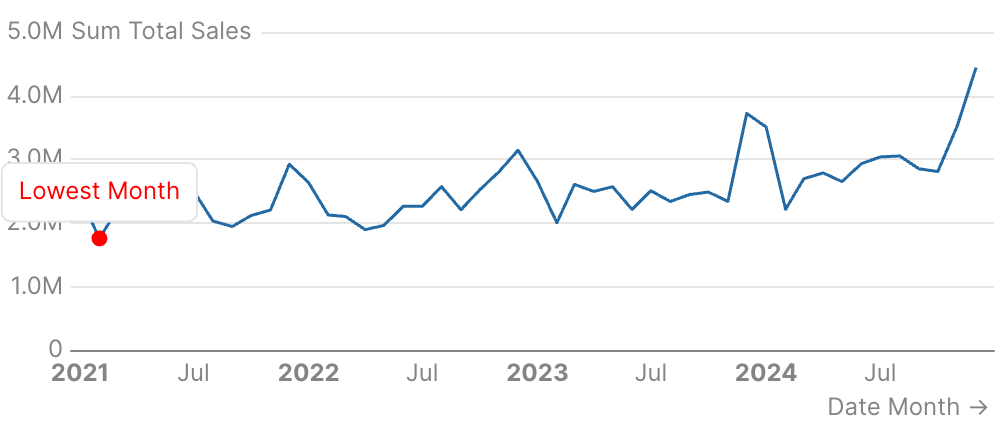
Callout Style
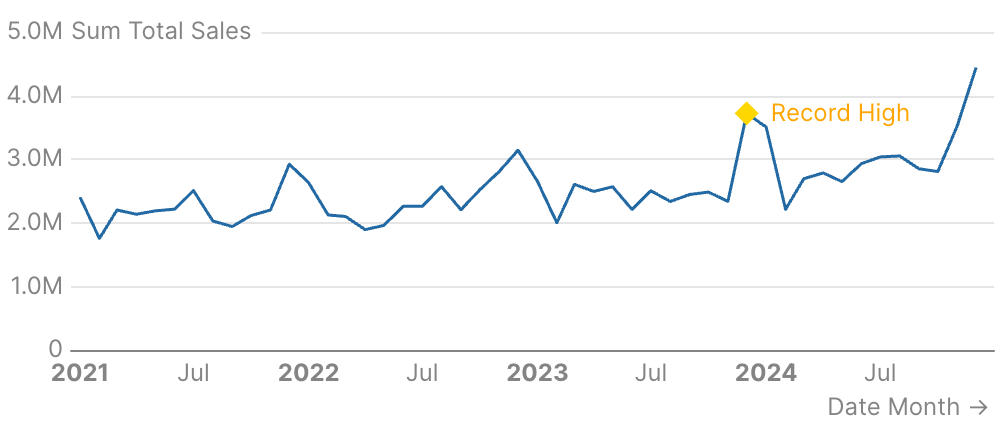
Custom Symbol
Attributes
Query name to use for placing multiple points from data
Text label to display at the reference point
Color of the point marker
X-axis position of the point (e.g., a date or category)
Y-axis position of the point (e.g., a value)
Styling options for the label
Styling options for the point markerExample:Attributes:
- shape:
string- Allowed values:
circleemptyCirclerectroundRecttrianglediamondpinarrownoneimage://path://
- Allowed values:
- size:
number - color:
string