Examples
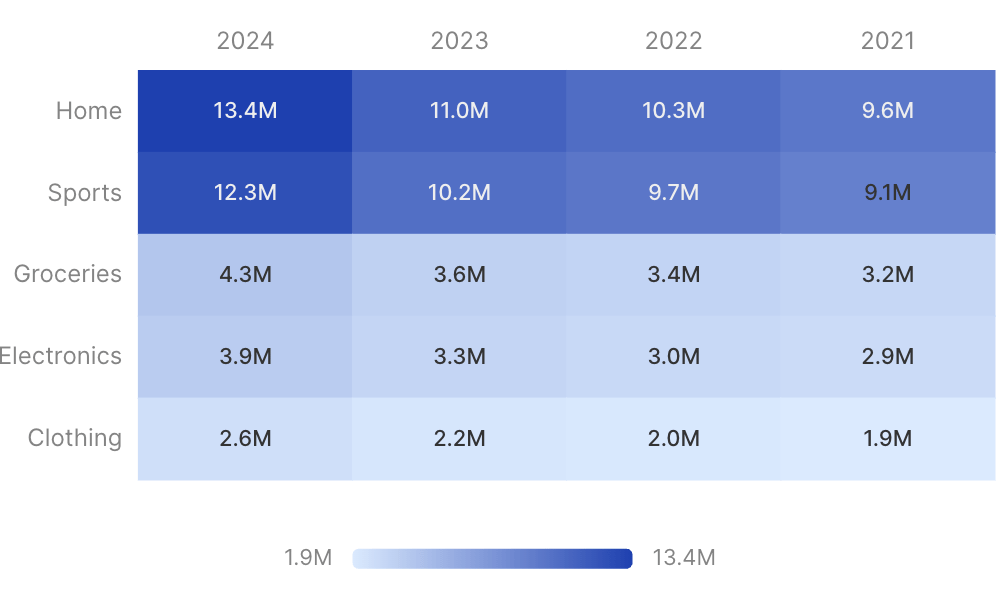
Basic Usage
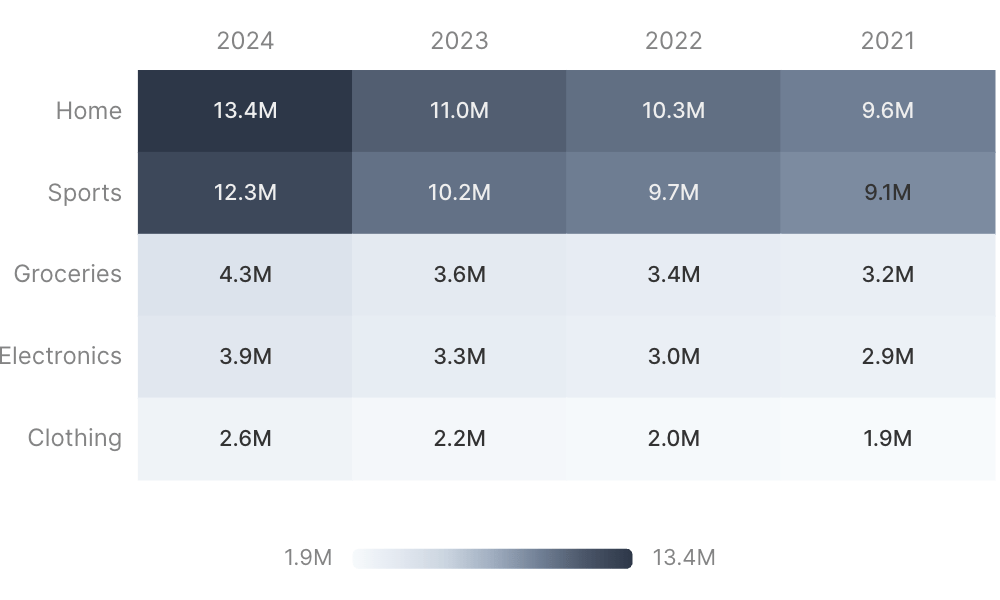
With Custom Colors
Attributes
Name of the table to query
IDs of filters to apply to the query
Use date_range to filter data for specific time periods. Accepts predefined ranges (e.g., “last 12 months”), dynamic ranges (e.g., “Last 90 days”), custom date ranges (e.g., “2020-01-01 to 2023-03-01”), or partial ranges (e.g., “from 2020-01-01”, “until 2023-03-01”)Example:Attributes:
- range:
string- Time period to filter. Use presets like ‘last 7 days’, dynamic patterns like ‘Last 90 days’, custom ranges like ‘2020-01-01 to 2023-03-01’, or partial ranges like ‘from 2020-01-01’.- Allowed values:
todayyesterdaylast 7 dayslast 30 dayslast 3 monthslast 6 monthslast 12 monthsprevious weekprevious monthprevious quarterprevious yearthis weekthis monththis quarterthis yearnext weeknext monthnext quarternext yearweek to datemonth to datequarter to dateyear to dateall time
- Allowed values:
- date:
string- Date column to filter on. Required when the data has multiple date columns.
Bucket dates into a grain. Pass the raw date column as
x and the chart truncates and groups for you. Temporal grains (day, week, month, quarter, year, hour) preserve the year — use for time-series. Seasonality grains (day of week, day of month, day of year, week of year, month of year, quarter of year) collapse across years — use for cyclical patterns like “which month sells most regardless of year”.Allowed values:dayweekmonthquarteryearhourday of weekday of monthday of yearweek of yearmonth of yearquarter of year
Column name for x-axis categories
Column name for y-axis categories
Title to display for the x-axis
Title to display for the y-axis
Column name for cell values
Title to display above the chart
Subtitle to display below the title
Info text to display in a tooltip next to the title. Can only be used with the title prop.
URL to link the info text to (can only be used with info)
Create a custom link title for the info link, placed after the info text (can only be used with info_link)
Format for values. See Value Formatting for available formats.
Format for x axis labels. See Value Formatting for available formats.
Format for y axis labels. See Value Formatting for available formats.
Sort order for x axis categories (asc or desc)Allowed values:
ascdesc
Sort order for y axis categories (asc or desc)Allowed values:
ascdesc
Sort categories by total value (asc or desc). Applies to the first axis without explicit sort.Allowed values:
ascdesc
Show color scale legend
Show borders around heatmap cells
Chart configuration optionsExample:Attributes:
- color_scale:
array of strings- Array of hex colors for the heatmap gradient. A single-color array auto-expands to [background, color]. - color_palette:
array of strings- Deprecated. Usecolor_scale.
Time in seconds between automatic data refreshes (minimum 60). Overrides the page-level auto-refresh setting for this component.
Custom SQL WHERE condition to apply to the query. For date filters, use date_range instead.
Custom SQL HAVING condition to apply to the query after GROUP BY
Maximum number of rows to return from the query. Note: When used with tables, limit will disable subtotals to prevent incomplete subtotal rows.
Column name(s) with optional direction (e.g. “column_name”, “column_name desc”)
Custom SQL QUALIFY condition to filter windowed results
Set the width of this component (in percent) relative to the page width
Set a fixed height for the chart in pixels
Link this chart to others sharing the same id, syncing their tooltips, axis-pointer, and zoom
Extra columns to include in the tooltip on hover. Each entry is
{ value, label?, fmt?, color_by_sign?, down_is_good? }. See the tooltip fields guide for examples.Raw ECharts options deep-merged over the chart’s final configuration. Use for anything the structured props do not expose —
graphic, visualMap, tooltip styling, and so on. Partial overrides win key-by-key without clobbering Studio’s computed siblings. For overrides scoped to the data series, use echarts_series_options.Example:Raw ECharts series options deep-merged into the chart series. Use for series-level styling the structured props do not expose.Example: