Examples
Basic Map
Map with Title
{% map title="Sales by Region" %}
{% /map %}
Custom Height
{% map height=500 %}
{% /map %}
Custom Zoom Level
{% map zoom=10 %}
{% /map %}
Map with Choropleth Layer
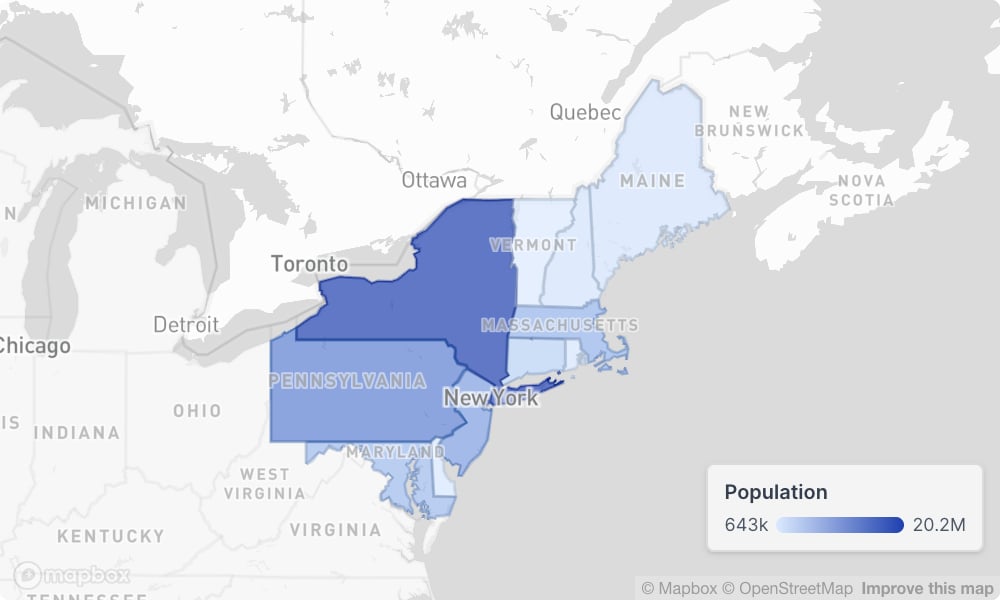
```sql east_coast_states
    select 'Maine' as state, 1362359 as population union all
    select 'New Hampshire', 1377529 union all
    select 'Vermont', 643077 union all
    select 'Massachusetts', 7029917 union all
    select 'Rhode Island', 1097379 union all
    select 'Connecticut', 3605944 union all
    select 'New York', 20201249 union all
    select 'New Jersey', 9288994 union all
    select 'Pennsylvania', 13002700 union all
    select 'Delaware', 989948 union all
    select 'Maryland', 6177224
```

{% map %}
    {% area_layer
        geography="us_states"
        match_by="name"
        data="east_coast_states"
        area_id="state"
        value="population"
    /%}
{% /map %}
Map with Point Layer
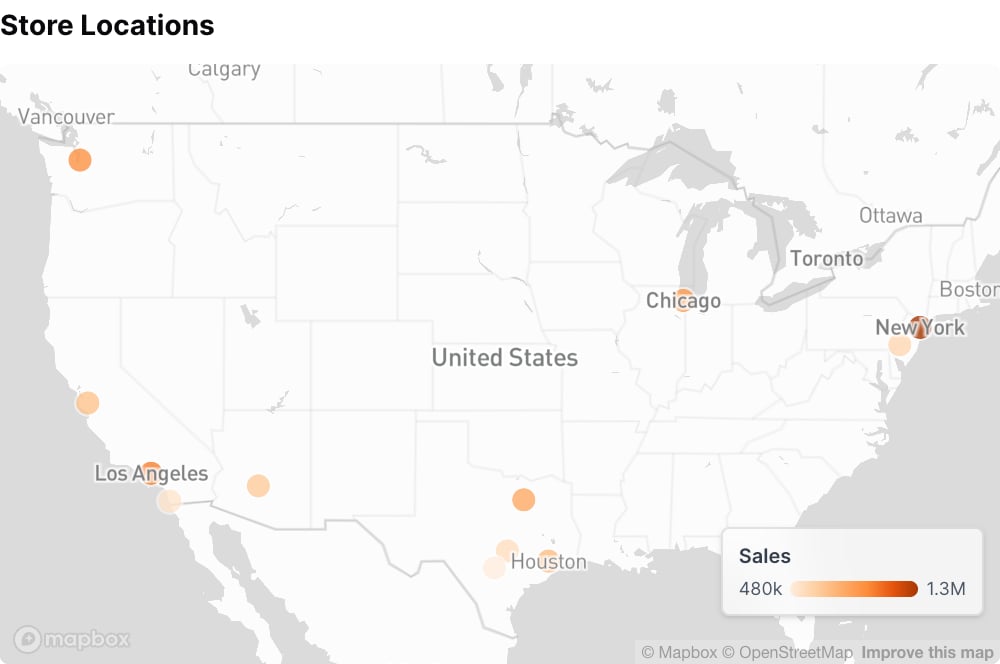
```sql us_stores
select 40.7128 as lat, -74.0060 as lng, 1250000 as sales union all
select 34.0522, -118.2437, 980000 union all
select 41.8781, -87.6298, 875000 union all
select 29.7604, -95.3698, 720000 union all
select 33.4484, -112.0740, 650000 union all
select 39.9526, -75.1652, 590000 union all
select 29.4241, -98.4936, 480000 union all
select 32.7157, -117.1611, 520000 union all
select 32.7767, -96.7970, 810000 union all
select 37.3382, -121.8863, 690000 union all
select 30.2672, -97.7431, 560000 union all
select 47.6062, -122.3321, 920000
```

{% map title="Store Locations" %}
    {% point_layer
        data="us_stores"
        lat="lat"
        lng="lng"
        color_value="sales"
        color_palette=["#feedde", "#fdd0a2", "#fdae6b", "#fd8d3c", "#e6550d", "#a63603"]
    /%}
{% /map %}
Map with Heatmap Layer
{% map title="Activity Density" %}
    {% heatmap_layer
        data="events"
        lat="latitude"
        lng="longitude"
        weight="event_count"
    /%}
{% /map %}
Attributes
Title to display above the map
Subtitle to display below the title
Information tooltip text (can only be used with title)
URL to link the info text to (can only be used with info)
Create a custom link title for the info link, placed after the info text (can only be used with info_link)
Height of the map in pixels
Initial map center position as [latitude, longitude]. Overrides auto-zoom to data bounds
Zoom level (0-22, where higher is more zoomed in). When provided without initial_position, centers on data at this zoom level. When provided with initial_position, uses this zoom at that position
Allow users to zoom in/out on the map
Allow users to pan/drag the map
Base map style: “mono” for theme-aware monochrome basemap, “blank” for solid background onlyAllowed values: Map projection: “globe” for 3D globe view, “flat” for 2D flat mapAllowed values: Show legends for map layers
legend_location
string
default:"bottom_right"
Location of the legend within the mapAllowed values:
top_lefttop_rightbottom_leftbottom_right
Set the width of this component (in percent) relative to the page width
Allowed Children