> ## Documentation Index
> Fetch the complete documentation index at: https://docs.evidence.studio/llms.txt
> Use this file to discover all available pages before exploring further.
# Reference Point
> Add a reference point inside a chart
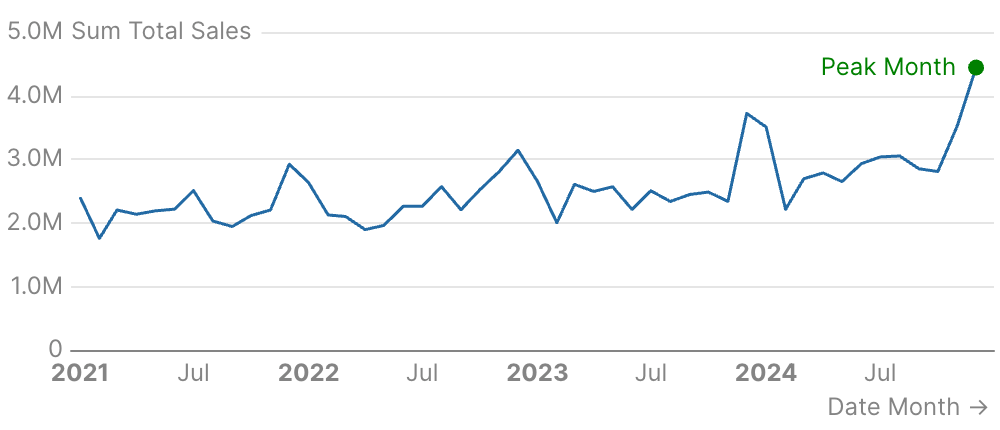 ```liquid theme={null}
{% line_chart
data="demo.daily_orders"
x="date"
y="sum(total_sales)"
date_grain="month"
%}
{% reference_point
x="2024-12-01"
y=4441307
label="Peak Month"
color="green"
label_options={
position="left"
}
/%}
{% /line_chart %}
```
## Examples
### Hardcoded Point
```liquid theme={null}
{% line_chart
data="demo.daily_orders"
x="date"
y="sum(total_sales)"
date_grain="month"
%}
{% reference_point
x="2024-12-01"
y=4441307
label="Peak Month"
color="green"
label_options={
position="left"
}
/%}
{% /line_chart %}
```
### Point from Data
```liquid theme={null}
{% line_chart
data="demo.daily_orders"
x="date"
y="sum(total_sales)"
date_grain="month"
%}
{% reference_point
x="2024-12-01"
y=4441307
label="Peak Month"
color="green"
label_options={
position="left"
}
/%}
{% /line_chart %}
```
## Examples
### Hardcoded Point
```liquid theme={null}
{% line_chart
data="demo.daily_orders"
x="date"
y="sum(total_sales)"
date_grain="month"
%}
{% reference_point
x="2024-12-01"
y=4441307
label="Peak Month"
color="green"
label_options={
position="left"
}
/%}
{% /line_chart %}
```
### Point from Data
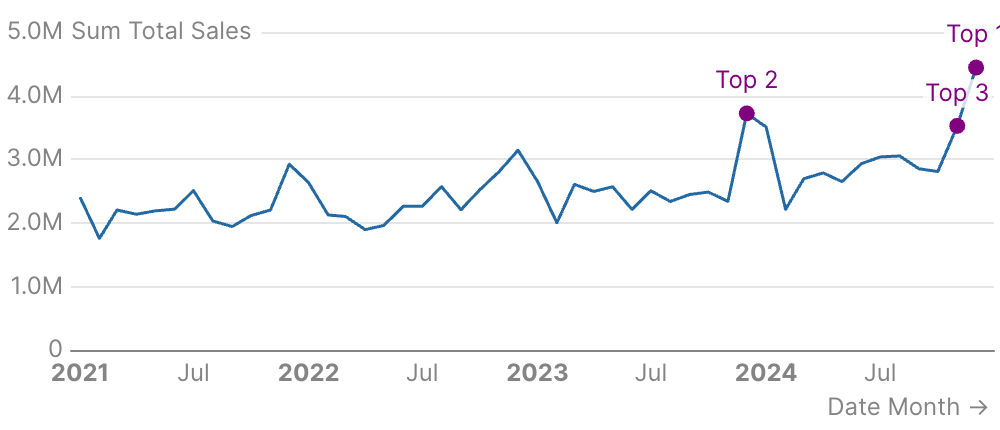 ````liquid theme={null}
```sql top_months
select
toStartOfMonth(date) as month,
sum(total_sales) as sales,
'Top ' || row_number() over (order by sum(total_sales) desc) as label
from demo.daily_orders
group by month
order by sales desc
limit 3
```
{% line_chart
data="demo.daily_orders"
x="date"
y="sum(total_sales)"
date_grain="month"
%}
{% reference_point
data="top_months"
x="month"
y="sales"
label="label"
color="purple"
/%}
{% /line_chart %}
````
### Callout Style
````liquid theme={null}
```sql top_months
select
toStartOfMonth(date) as month,
sum(total_sales) as sales,
'Top ' || row_number() over (order by sum(total_sales) desc) as label
from demo.daily_orders
group by month
order by sales desc
limit 3
```
{% line_chart
data="demo.daily_orders"
x="date"
y="sum(total_sales)"
date_grain="month"
%}
{% reference_point
data="top_months"
x="month"
y="sales"
label="label"
color="purple"
/%}
{% /line_chart %}
````
### Callout Style
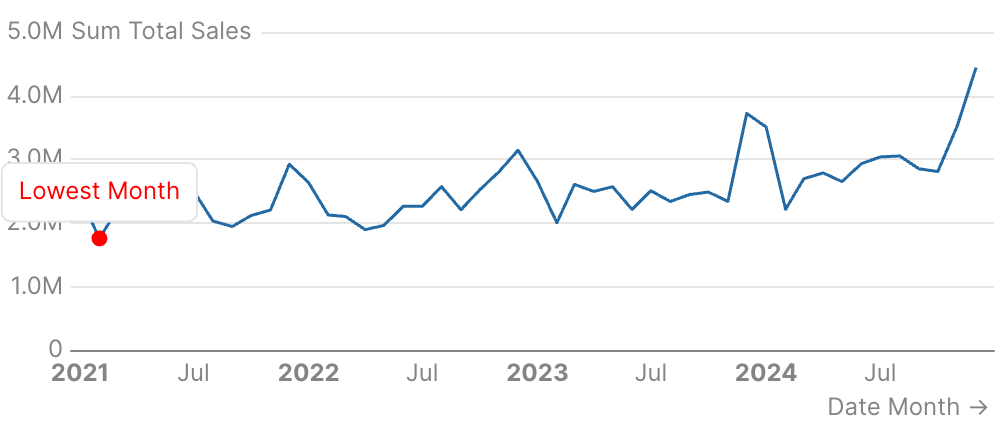 ```liquid theme={null}
{% line_chart
data="demo.daily_orders"
x="date"
y="sum(total_sales)"
date_grain="month"
%}
{% reference_point
x="2021-02-01"
y=1754436
label="Lowest Month"
color="red"
label_options={
variant="callout"
position="top"
}
/%}
{% /line_chart %}
```
### Custom Symbol
```liquid theme={null}
{% line_chart
data="demo.daily_orders"
x="date"
y="sum(total_sales)"
date_grain="month"
%}
{% reference_point
x="2021-02-01"
y=1754436
label="Lowest Month"
color="red"
label_options={
variant="callout"
position="top"
}
/%}
{% /line_chart %}
```
### Custom Symbol
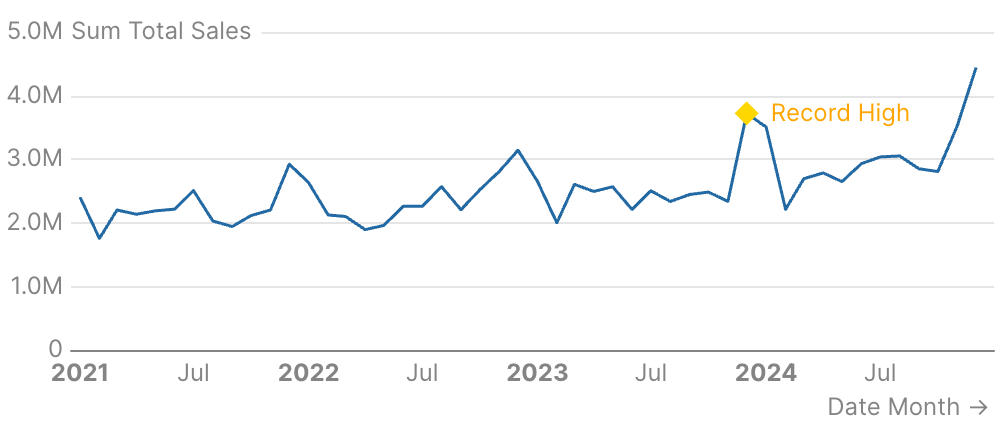 ```liquid theme={null}
{% line_chart
data="demo.daily_orders"
x="date"
y="sum(total_sales)"
date_grain="month"
%}
{% reference_point
x="2023-12-01"
y=3720260
label="Record High"
symbol_options={
shape="diamond"
size=12
color="gold"
}
label_options={
position="right"
color="orange"
}
/%}
{% /line_chart %}
```
## Attributes
Query name to use for placing multiple points from data
Text label to display at the reference point
Color of the point marker
X-axis position of the point (e.g., a date or category)
Y-axis position of the point (e.g., a value)
Styling options for the label
Styling options for the point marker
**Example:**
```
symbol_options={
shape = "circle"
size = 0
color = "string"
}
```
**Attributes:**
* shape: `string`
* **Allowed values:**
* `circle`
* `emptyCircle`
* `rect`
* `roundRect`
* `triangle`
* `diamond`
* `pin`
* `arrow`
* `none`
* `image://`
* `path://`
* size: `number`
* color: `string`
## Allowed Parents
* [area\_chart](/components/area_chart)
* [bar\_chart](/components/bar_chart)
* [bubble\_chart](/components/bubble_chart)
* [combo\_chart](/components/combo_chart)
* [horizontal\_bar\_chart](/components/horizontal_bar_chart)
* [line\_chart](/components/line_chart)
* [scatter\_chart](/components/scatter_chart)
```liquid theme={null}
{% line_chart
data="demo.daily_orders"
x="date"
y="sum(total_sales)"
date_grain="month"
%}
{% reference_point
x="2023-12-01"
y=3720260
label="Record High"
symbol_options={
shape="diamond"
size=12
color="gold"
}
label_options={
position="right"
color="orange"
}
/%}
{% /line_chart %}
```
## Attributes
Query name to use for placing multiple points from data
Text label to display at the reference point
Color of the point marker
X-axis position of the point (e.g., a date or category)
Y-axis position of the point (e.g., a value)
Styling options for the label
Styling options for the point marker
**Example:**
```
symbol_options={
shape = "circle"
size = 0
color = "string"
}
```
**Attributes:**
* shape: `string`
* **Allowed values:**
* `circle`
* `emptyCircle`
* `rect`
* `roundRect`
* `triangle`
* `diamond`
* `pin`
* `arrow`
* `none`
* `image://`
* `path://`
* size: `number`
* color: `string`
## Allowed Parents
* [area\_chart](/components/area_chart)
* [bar\_chart](/components/bar_chart)
* [bubble\_chart](/components/bubble_chart)
* [combo\_chart](/components/combo_chart)
* [horizontal\_bar\_chart](/components/horizontal_bar_chart)
* [line\_chart](/components/line_chart)
* [scatter\_chart](/components/scatter_chart)