> ## Documentation Index
> Fetch the complete documentation index at: https://docs.evidence.studio/llms.txt
> Use this file to discover all available pages before exploring further.
# Reference Area
> Add a reference area inside a chart
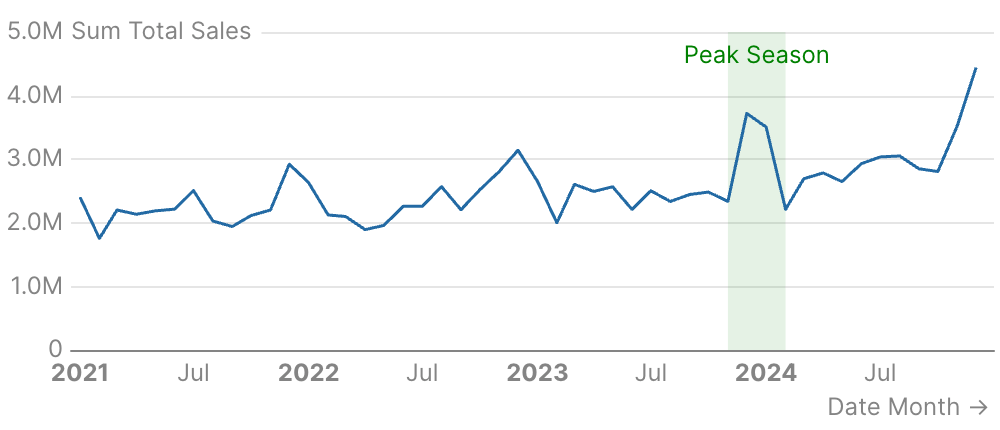 ```liquid theme={null}
{% line_chart
data="demo.daily_orders"
x="date"
y="sum(total_sales)"
date_grain="month"
%}
{% reference_area
x_min="2023-11-01"
x_max="2024-02-01"
label="Peak Season"
color="green"
/%}
{% /line_chart %}
```
## Examples
### Highlight Date Range
```liquid theme={null}
{% line_chart
data="demo.daily_orders"
x="date"
y="sum(total_sales)"
date_grain="month"
%}
{% reference_area
x_min="2023-11-01"
x_max="2024-02-01"
label="Peak Season"
color="green"
/%}
{% /line_chart %}
```
### Horizontal Value Band
```liquid theme={null}
{% line_chart
data="demo.daily_orders"
x="date"
y="sum(total_sales)"
date_grain="month"
%}
{% reference_area
x_min="2023-11-01"
x_max="2024-02-01"
label="Peak Season"
color="green"
/%}
{% /line_chart %}
```
## Examples
### Highlight Date Range
```liquid theme={null}
{% line_chart
data="demo.daily_orders"
x="date"
y="sum(total_sales)"
date_grain="month"
%}
{% reference_area
x_min="2023-11-01"
x_max="2024-02-01"
label="Peak Season"
color="green"
/%}
{% /line_chart %}
```
### Horizontal Value Band
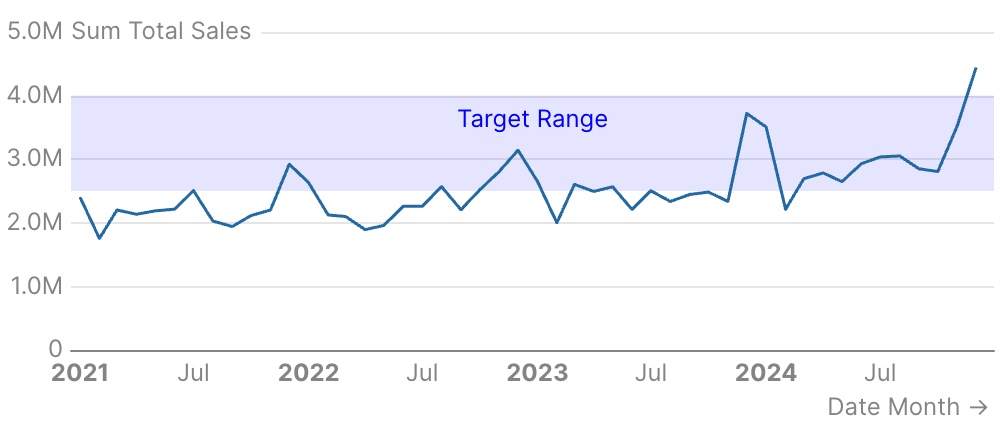 ```liquid theme={null}
{% line_chart
data="demo.daily_orders"
x="date"
y="sum(total_sales)"
date_grain="month"
%}
{% reference_area
y_min=2500000
y_max=4000000
label="Target Range"
color="blue"
/%}
{% /line_chart %}
```
### Areas from Data
```liquid theme={null}
{% line_chart
data="demo.daily_orders"
x="date"
y="sum(total_sales)"
date_grain="month"
%}
{% reference_area
y_min=2500000
y_max=4000000
label="Target Range"
color="blue"
/%}
{% /line_chart %}
```
### Areas from Data
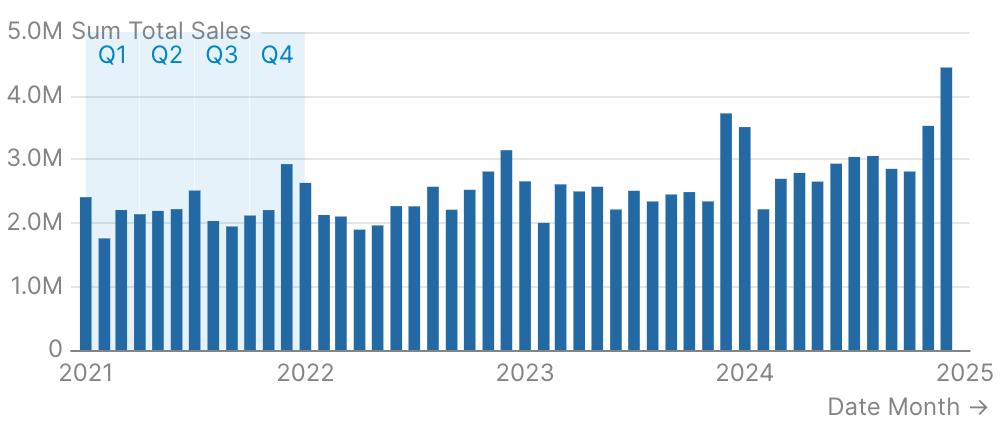 ````liquid theme={null}
```sql seasons
select '2021-01-01' as start_date, '2021-03-31' as end_date, 'Q1' as quarter
union all
select '2021-04-01', '2021-06-30', 'Q2'
union all
select '2021-07-01', '2021-09-30', 'Q3'
union all
select '2021-10-01', '2021-12-31', 'Q4'
```
{% bar_chart
data="demo.daily_orders"
x="date"
y="sum(total_sales)"
date_grain="month"
%}
{% reference_area
data="seasons"
x_min="start_date"
x_max="end_date"
label="quarter"
/%}
{% /bar_chart %}
````
### Custom Styling
````liquid theme={null}
```sql seasons
select '2021-01-01' as start_date, '2021-03-31' as end_date, 'Q1' as quarter
union all
select '2021-04-01', '2021-06-30', 'Q2'
union all
select '2021-07-01', '2021-09-30', 'Q3'
union all
select '2021-10-01', '2021-12-31', 'Q4'
```
{% bar_chart
data="demo.daily_orders"
x="date"
y="sum(total_sales)"
date_grain="month"
%}
{% reference_area
data="seasons"
x_min="start_date"
x_max="end_date"
label="quarter"
/%}
{% /bar_chart %}
````
### Custom Styling
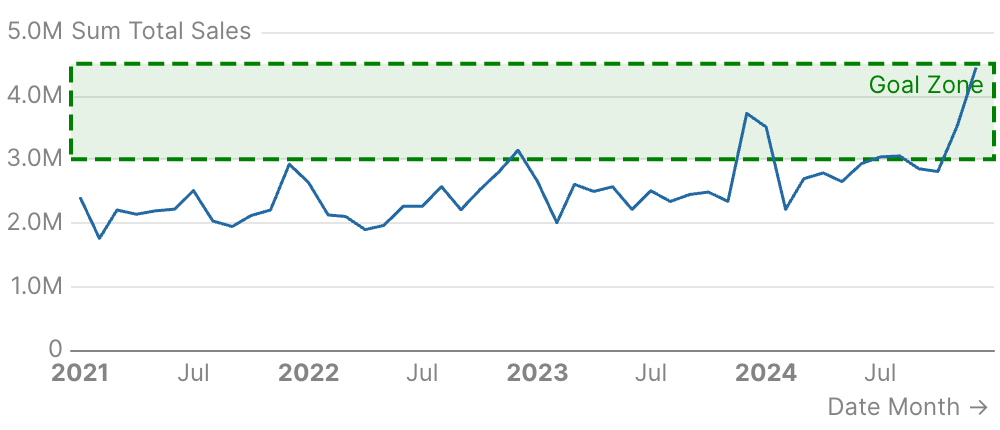 ```liquid theme={null}
{% line_chart
data="demo.daily_orders"
x="date"
y="sum(total_sales)"
date_grain="month"
%}
{% reference_area
y_min=3000000
y_max=4500000
label="Goal Zone"
color="green"
area_options={
border={ width=2 type="dashed" color="green" }
}
label_options={
position="top_right"
color="green"
}
/%}
{% /line_chart %}
```
## Attributes
Query name to use for calculating dynamic area boundaries
Text label to display in the reference area
Left boundary of the area (e.g., a start date)
Right boundary of the area (e.g., an end date)
Bottom boundary of the area (e.g., a minimum value)
Top boundary of the area (e.g., a maximum value)
Fill color of the reference area
Styling options for the label
**Example:**
```
label_options={
position = "top_left"
align = "left"
color = "string"
background_color = "string"
padding = 0
border = {
width = 0
type = "solid"
color = "string"
radius = 0
}
text = {
size = 0
bold = true
italic = true
}
}
```
**Attributes:**
* position: `string`
* **Allowed values:**
* `top_left`
* `top`
* `top_right`
* `bottom_left`
* `bottom`
* `bottom_right`
* `left`
* `center`
* `right`
* align: `string`
* **Allowed values:**
* `left`
* `center`
* `right`
* color: `string`
* background\_color: `string`
* padding: `number`
* border: `options group`
* **Options:**
* width: `number`
* type: `string`
* **Allowed values:**
* `solid`
* `dashed`
* `dotted`
* color: `string`
* radius: `number`
* text: `options group`
* **Options:**
* size: `number`
* bold: `boolean`
* italic: `boolean`
Styling options for the area fill and border
**Example:**
```
area_options={
color = "string"
opacity = 0
border = {
width = 0
type = "solid"
color = "string"
}
}
```
**Attributes:**
* color: `string`
* opacity: `number`
* border: `options group`
* **Options:**
* width: `number`
* type: `string`
* **Allowed values:**
* `solid`
* `dashed`
* `dotted`
* color: `string`
## Allowed Parents
* [area\_chart](/components/area_chart)
* [bar\_chart](/components/bar_chart)
* [bubble\_chart](/components/bubble_chart)
* [combo\_chart](/components/combo_chart)
* [horizontal\_bar\_chart](/components/horizontal_bar_chart)
* [line\_chart](/components/line_chart)
* [scatter\_chart](/components/scatter_chart)
```liquid theme={null}
{% line_chart
data="demo.daily_orders"
x="date"
y="sum(total_sales)"
date_grain="month"
%}
{% reference_area
y_min=3000000
y_max=4500000
label="Goal Zone"
color="green"
area_options={
border={ width=2 type="dashed" color="green" }
}
label_options={
position="top_right"
color="green"
}
/%}
{% /line_chart %}
```
## Attributes
Query name to use for calculating dynamic area boundaries
Text label to display in the reference area
Left boundary of the area (e.g., a start date)
Right boundary of the area (e.g., an end date)
Bottom boundary of the area (e.g., a minimum value)
Top boundary of the area (e.g., a maximum value)
Fill color of the reference area
Styling options for the label
**Example:**
```
label_options={
position = "top_left"
align = "left"
color = "string"
background_color = "string"
padding = 0
border = {
width = 0
type = "solid"
color = "string"
radius = 0
}
text = {
size = 0
bold = true
italic = true
}
}
```
**Attributes:**
* position: `string`
* **Allowed values:**
* `top_left`
* `top`
* `top_right`
* `bottom_left`
* `bottom`
* `bottom_right`
* `left`
* `center`
* `right`
* align: `string`
* **Allowed values:**
* `left`
* `center`
* `right`
* color: `string`
* background\_color: `string`
* padding: `number`
* border: `options group`
* **Options:**
* width: `number`
* type: `string`
* **Allowed values:**
* `solid`
* `dashed`
* `dotted`
* color: `string`
* radius: `number`
* text: `options group`
* **Options:**
* size: `number`
* bold: `boolean`
* italic: `boolean`
Styling options for the area fill and border
**Example:**
```
area_options={
color = "string"
opacity = 0
border = {
width = 0
type = "solid"
color = "string"
}
}
```
**Attributes:**
* color: `string`
* opacity: `number`
* border: `options group`
* **Options:**
* width: `number`
* type: `string`
* **Allowed values:**
* `solid`
* `dashed`
* `dotted`
* color: `string`
## Allowed Parents
* [area\_chart](/components/area_chart)
* [bar\_chart](/components/bar_chart)
* [bubble\_chart](/components/bubble_chart)
* [combo\_chart](/components/combo_chart)
* [horizontal\_bar\_chart](/components/horizontal_bar_chart)
* [line\_chart](/components/line_chart)
* [scatter\_chart](/components/scatter_chart)