> ## Documentation Index
> Fetch the complete documentation index at: https://docs.evidence.studio/llms.txt
> Use this file to discover all available pages before exploring further.
# Histogram
> Display a histogram chart showing the distribution of values in a column.
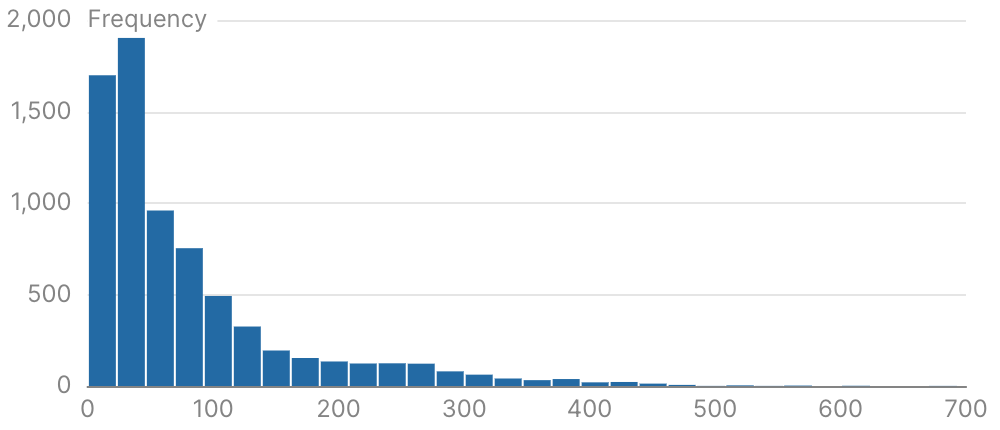 ```liquid theme={null}
{% histogram
data="demo.daily_orders"
value="transactions"
bin_count=30
/%}
```
## Examples
### Basic Usage
```liquid theme={null}
{% histogram
data="demo.daily_orders"
value="transactions"
bin_count=30
/%}
```
## Attributes
Name of the table to query
SQL expression for the values to create histogram for
Column name to group data by series
Chart configuration options
**Example:**
```
chart_options={
color_palette = ["value1", "value2"]
}
```
**Attributes:**
* color\_palette: `array of strings`
Number of bins for the histogram (takes precedence over bin\_width)
Width of each bin (ignored if bin\_count is specified)
Format for the column values displayed in bin ranges. See [Value Formatting](/core-concepts/value-formatting) for available formats.
IDs of filters to apply to the query
Title to display above the histogram
Subtitle to display below the title
Info text to display in a tooltip next to the title. Can only be used with the title prop.
URL to link the info text to (can only be used with info)
Create a custom link title for the info link, placed after the info text (can only be used with info\_link)
Show legend
Position of the legend (top or bottom)
**Allowed values:**
* `top`
* `bottom`
Time in seconds between automatic data refreshes (minimum 60). Overrides the page-level auto-refresh setting for this component.
Custom SQL WHERE condition to apply to the query. For date filters, use date\_range instead.
Maximum number of rows to return from the query. Note: When used with tables, limit will disable subtotals to prevent incomplete subtotal rows.
Set the width of this component (in percent) relative to the page width
Set a fixed height for the chart in pixels
Link this chart to others sharing the same id, syncing their tooltips, axis-pointer, and zoom
Raw [ECharts options](https://echarts.apache.org/en/option.html) deep-merged over the chart's final configuration. Use for anything the structured props do not expose — `graphic`, `visualMap`, tooltip styling, and so on. Partial overrides win key-by-key without clobbering Studio's computed siblings. For overrides scoped to the data series, use `echarts_series_options`.
**Example:**
```
echarts_options={
tooltip={ position="top" }
graphic=[{ type="text" }]
}
```
Raw [ECharts series options](https://echarts.apache.org/en/option.html#series) deep-merged into the chart series. Use for series-level styling the structured props do not expose.
**Example:**
```
echarts_series_options={
itemStyle={ borderRadius=8 }
}
```
```liquid theme={null}
{% histogram
data="demo.daily_orders"
value="transactions"
bin_count=30
/%}
```
## Examples
### Basic Usage
```liquid theme={null}
{% histogram
data="demo.daily_orders"
value="transactions"
bin_count=30
/%}
```
## Attributes
Name of the table to query
SQL expression for the values to create histogram for
Column name to group data by series
Chart configuration options
**Example:**
```
chart_options={
color_palette = ["value1", "value2"]
}
```
**Attributes:**
* color\_palette: `array of strings`
Number of bins for the histogram (takes precedence over bin\_width)
Width of each bin (ignored if bin\_count is specified)
Format for the column values displayed in bin ranges. See [Value Formatting](/core-concepts/value-formatting) for available formats.
IDs of filters to apply to the query
Title to display above the histogram
Subtitle to display below the title
Info text to display in a tooltip next to the title. Can only be used with the title prop.
URL to link the info text to (can only be used with info)
Create a custom link title for the info link, placed after the info text (can only be used with info\_link)
Show legend
Position of the legend (top or bottom)
**Allowed values:**
* `top`
* `bottom`
Time in seconds between automatic data refreshes (minimum 60). Overrides the page-level auto-refresh setting for this component.
Custom SQL WHERE condition to apply to the query. For date filters, use date\_range instead.
Maximum number of rows to return from the query. Note: When used with tables, limit will disable subtotals to prevent incomplete subtotal rows.
Set the width of this component (in percent) relative to the page width
Set a fixed height for the chart in pixels
Link this chart to others sharing the same id, syncing their tooltips, axis-pointer, and zoom
Raw [ECharts options](https://echarts.apache.org/en/option.html) deep-merged over the chart's final configuration. Use for anything the structured props do not expose — `graphic`, `visualMap`, tooltip styling, and so on. Partial overrides win key-by-key without clobbering Studio's computed siblings. For overrides scoped to the data series, use `echarts_series_options`.
**Example:**
```
echarts_options={
tooltip={ position="top" }
graphic=[{ type="text" }]
}
```
Raw [ECharts series options](https://echarts.apache.org/en/option.html#series) deep-merged into the chart series. Use for series-level styling the structured props do not expose.
**Example:**
```
echarts_series_options={
itemStyle={ borderRadius=8 }
}
```