> ## Documentation Index
> Fetch the complete documentation index at: https://docs.evidence.studio/llms.txt
> Use this file to discover all available pages before exploring further.
# Dimension Grid
> Display an interactive grid of dimension columns with aggregated metrics and bar visualizations for filtering
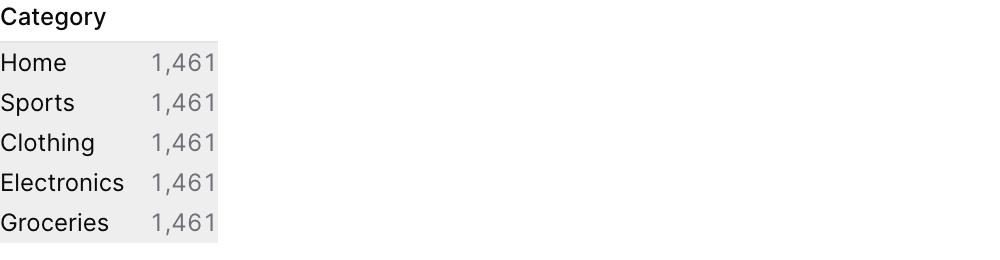 ```liquid theme={null}
{% dimension_grid
id="product_filter"
data="demo.daily_orders"
/%}
```
## Examples
### Basic Usage
```liquid theme={null}
{% dimension_grid
id="product_filter"
data="demo.daily_orders"
/%}
```
### With Explicit Dimensions and Metric
```liquid theme={null}
{% dimension_grid
id="sales_filter"
data="orders"
dimensions=["category", "region"]
metric="sum(sales)"
fmt="usd"
limit=5
/%}
```
### Using Filter in Query
```liquid theme={null}
{% dimension_grid
id="product_filter"
data="demo.daily_orders"
/%}
```
## Examples
### Basic Usage
```liquid theme={null}
{% dimension_grid
id="product_filter"
data="demo.daily_orders"
/%}
```
### With Explicit Dimensions and Metric
```liquid theme={null}
{% dimension_grid
id="sales_filter"
data="orders"
dimensions=["category", "region"]
metric="sum(sales)"
fmt="usd"
limit=5
/%}
```
### Using Filter in Query
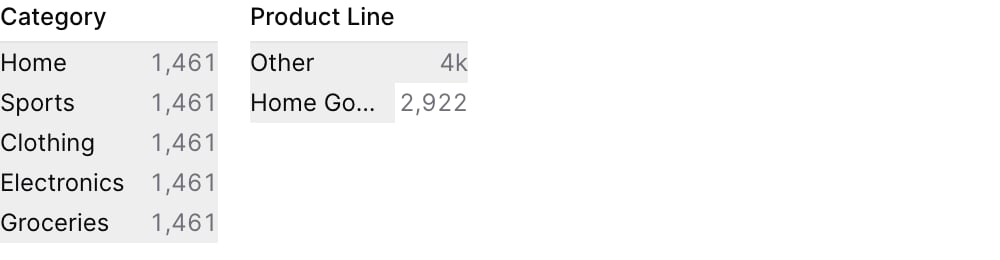 ````liquid theme={null}
{% dimension_grid id="order_filter" data="orders" /%}
```sql filtered_orders
select * from orders
where {{order_filter.filter}}
```
````
## Attributes
The id of the dimension grid to use in a `filters` prop
Name of the table to query
Array of column names to display as dimensions. If not provided, auto-detects string columns.
SQL aggregation expression (default: count(\*))
Label displayed above the metric values
Format code for the metric values (e.g., "num0", "usd", "pct1"). See [Value Formatting](/core-concepts/value-formatting) for available formats.
Maximum number of values to show per dimension (default: 10)
Allow multiple selections per dimension (default: true)
Array of filter IDs to apply when querying dimension values
SQL WHERE clause to filter data
Title displayed above the dimension grid
Subtitle displayed below the title
Use date\_range to filter data for specific time periods. Accepts predefined ranges (e.g., "last 12 months"), dynamic ranges (e.g., "Last 90 days"), custom date ranges (e.g., "2020-01-01 to 2023-03-01"), or partial ranges (e.g., "from 2020-01-01", "until 2023-03-01")
**Example:**
```
date_range={
range = "today"
date = "string"
}
```
**Attributes:**
* range: `string` - Time period to filter. Use presets like 'last 7 days', dynamic patterns like 'Last 90 days', custom ranges like '2020-01-01 to 2023-03-01', or partial ranges like 'from 2020-01-01'.
* **Allowed values:**
* `today`
* `yesterday`
* `last 7 days`
* `last 30 days`
* `last 3 months`
* `last 6 months`
* `last 12 months`
* `previous week`
* `previous month`
* `previous quarter`
* `previous year`
* `this week`
* `this month`
* `this quarter`
* `this year`
* `next week`
* `next month`
* `next quarter`
* `next year`
* `week to date`
* `month to date`
* `quarter to date`
* `year to date`
* `all time`
* date: `string` - Date column to filter on. Required when the data has multiple date columns.
Set the width of this component (in percent) relative to the page width
## Using the Filter Variable
Reference this filter using `{{filter_id}}`. The value returned depends on where you use it.
| Context | Default Property | No Selection | Result |
| ------- | ---------------- | ------------ | ------ |
### Available Properties
You can also access specific properties using `{{filter_id.property}}`:
#### .filter
Returns a complete SQL filter expression combining all dimension selections. Returns `true` when no values are selected.
````liquid theme={null}
{% dimension_grid id="dim_filter" data="orders" /%}
```sql filtered_orders
select * from orders
where {{dim_filter.filter}}
```
````
#### .selected
Returns an object with dimension names as keys and selected values as arrays. Useful for accessing individual dimension selections.
```liquid theme={null}
{% dimension_grid id="dim_filter" data="orders" dimensions=["category", "region"] /%}
Selected categories: {{dim_filter.category}}
Selected regions: {{dim_filter.region}}
```
#### .literal
Returns a human-readable summary of all selections.
```liquid theme={null}
{% dimension_grid id="dim_filter" data="orders" /%}
Active filters: {{dim_filter.literal}}
```
````liquid theme={null}
{% dimension_grid id="order_filter" data="orders" /%}
```sql filtered_orders
select * from orders
where {{order_filter.filter}}
```
````
## Attributes
The id of the dimension grid to use in a `filters` prop
Name of the table to query
Array of column names to display as dimensions. If not provided, auto-detects string columns.
SQL aggregation expression (default: count(\*))
Label displayed above the metric values
Format code for the metric values (e.g., "num0", "usd", "pct1"). See [Value Formatting](/core-concepts/value-formatting) for available formats.
Maximum number of values to show per dimension (default: 10)
Allow multiple selections per dimension (default: true)
Array of filter IDs to apply when querying dimension values
SQL WHERE clause to filter data
Title displayed above the dimension grid
Subtitle displayed below the title
Use date\_range to filter data for specific time periods. Accepts predefined ranges (e.g., "last 12 months"), dynamic ranges (e.g., "Last 90 days"), custom date ranges (e.g., "2020-01-01 to 2023-03-01"), or partial ranges (e.g., "from 2020-01-01", "until 2023-03-01")
**Example:**
```
date_range={
range = "today"
date = "string"
}
```
**Attributes:**
* range: `string` - Time period to filter. Use presets like 'last 7 days', dynamic patterns like 'Last 90 days', custom ranges like '2020-01-01 to 2023-03-01', or partial ranges like 'from 2020-01-01'.
* **Allowed values:**
* `today`
* `yesterday`
* `last 7 days`
* `last 30 days`
* `last 3 months`
* `last 6 months`
* `last 12 months`
* `previous week`
* `previous month`
* `previous quarter`
* `previous year`
* `this week`
* `this month`
* `this quarter`
* `this year`
* `next week`
* `next month`
* `next quarter`
* `next year`
* `week to date`
* `month to date`
* `quarter to date`
* `year to date`
* `all time`
* date: `string` - Date column to filter on. Required when the data has multiple date columns.
Set the width of this component (in percent) relative to the page width
## Using the Filter Variable
Reference this filter using `{{filter_id}}`. The value returned depends on where you use it.
| Context | Default Property | No Selection | Result |
| ------- | ---------------- | ------------ | ------ |
### Available Properties
You can also access specific properties using `{{filter_id.property}}`:
#### .filter
Returns a complete SQL filter expression combining all dimension selections. Returns `true` when no values are selected.
````liquid theme={null}
{% dimension_grid id="dim_filter" data="orders" /%}
```sql filtered_orders
select * from orders
where {{dim_filter.filter}}
```
````
#### .selected
Returns an object with dimension names as keys and selected values as arrays. Useful for accessing individual dimension selections.
```liquid theme={null}
{% dimension_grid id="dim_filter" data="orders" dimensions=["category", "region"] /%}
Selected categories: {{dim_filter.category}}
Selected regions: {{dim_filter.region}}
```
#### .literal
Returns a human-readable summary of all selections.
```liquid theme={null}
{% dimension_grid id="dim_filter" data="orders" /%}
Active filters: {{dim_filter.literal}}
```